Trading Indicators
Learn how to use RSI, MACD, Bollinger Bands, Moving Averages, and other trading indicators like a pro.


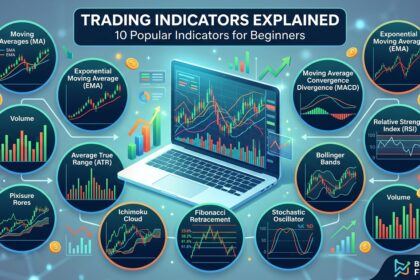


Position Sizing Explained: How Much to Risk Per Trade
Most beginners spend weeks searching for the perfect entry. Very few spend even an hour on the question that matters…
EMA vs SMA: Which Moving Average Should You Use?
If you've read our guide to moving averages, you already know they're one of the most fundamental tools in technical…
Stochastic Oscillator Explained: How to Use It in Trading
If you've already spent time with the RSI indicator, the stochastic oscillator is going to feel familiar almost immediately. Both…
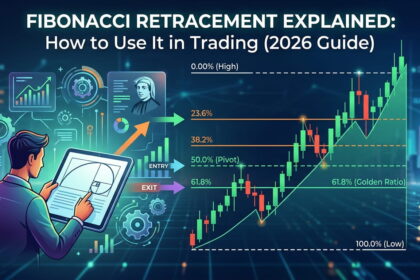
Fibonacci Retracement Explained: How to Use It in Trading
If you've spent any time looking at trading charts, you've probably noticed those odd diagonal lines with percentages like 38.2%…
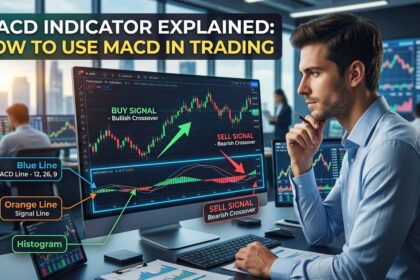
MACD Indicator Explained: How to Use MACD in Trading
The Moving Average Convergence Divergence, commonly known as MACD, is one of the most popular indicators used in technical analysis.…
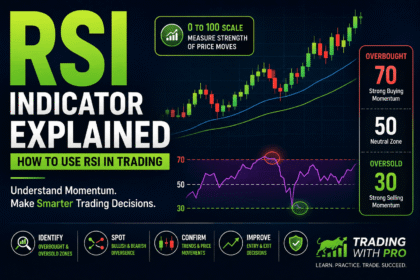
RSI Indicator Explained: How to Use RSI in Trading
The Relative Strength Index, commonly known as RSI, is one of the most popular momentum indicators used in technical analysis.…